
The map layer show the forecast water stress (proportion of annual water removal in relation to the total water availability annually) for the year 2040.
Economic development, urbanization, population growth as well as climate change influence water quality on the one hand, and the quantity of water available on the other. To evaluate the current situation of a country or a particular region, it helps to look at the proportion of the annual water removal by private households, industry and agriculture measured against the total availability of so-called blue water annually. Blue water is defined as all freshwater which is stored in lakes, rivers, bodies of groundwater or glaciers. A higher level of water stress indicates a higher level of competition among users.
The data shown in the map are sourced from the Aqueduct project of the World Resource Institute (WRI) and make forecasts of water stress for 2040 based on various scenarios from the Fifth Assessment Report of the Intergovernmental Panel on Climate Change (IPCC). The underlying business-as-usual scenario assumes relatively unrestricted emissions. It should be noted that the data shown from the study are fraught with a certain amount of uncertainty. Nonetheless, they provide an outlook on the difficulties to be expected in relation to future water supplies.
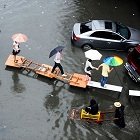
© picture-alliance / dpa
Water - Conflict or cooperation?
Since the end of the 1980s, the link between environment (degradation), (violent) conflict and security has formed part of both public and political debates as well as social science research.
More ...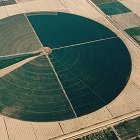
© picture alliance / Arco Images GmbH
Virtual water
Despite the success of the past 15 years in providing more people with safe access to clean water, today around 10 per cent of the world's population still do not have this access to clean water.
More ...")
")
")