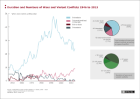
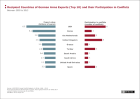
Infographics

image
image
Infographics

Frequency of Conflicts 1946 to 2016

The graph shows the total number of wars and violent conflicts a country was involved in from 1946 to 2016. The colour shade differs according to the frequency of its involvement; the conflict location is of no consequence for this.

More ...
image
Infographics

Executions and Death Penalties 2014

The illustration gives an overview of executions and death penalties. Besides the number of executions in 2014, the trend of usage and abolition of death penalty for 2004 to 2014 is illustrated.

More ...
image
Infographics

Critical Weapons and Arms Exports 2013

This chart shows exports of German weapons and military equipment to countries where the import of such goods constitutes a significant risk of a negative impact on sustainable development.

More ...
image

Buchhandlungen bangen um die Buchpreisbindung

Data tables

For some select map layers, the information portal ‘War and Peace’ provides the user with all used data sets as tables.

More ...
Magnifying Glass in front of a Boston map

Country portraits

In the country reports, data and information are collected by country and put into tables that are used in the modules as a basis for maps and illustrations.

More ...
Compass with Mirror

Navigation and operation

The information and data of each module are primarily made available as selectable map layers and are complemented by texts and graphs. The map layers can be found on the right hand side and are listed according to themes and sub-themes.

More ...